
Hickman Mills C-1 School District
Find out how Satchel Pulse improved the culture and climate to create a supportive learning environment for all.
View success storyAssess school climate, identify the issues your staff, students and community care about and create impactful interventions.
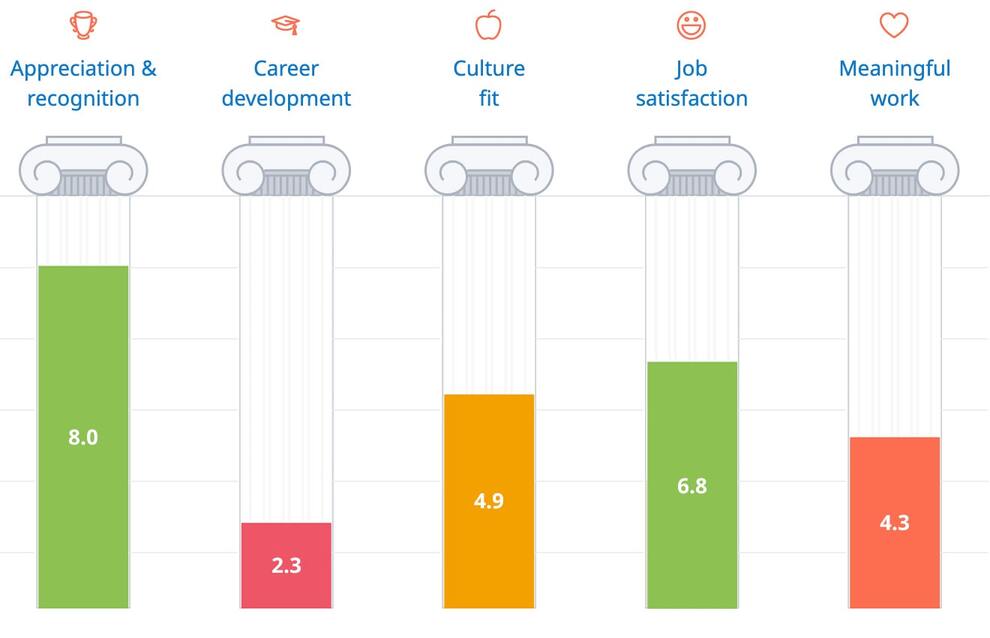
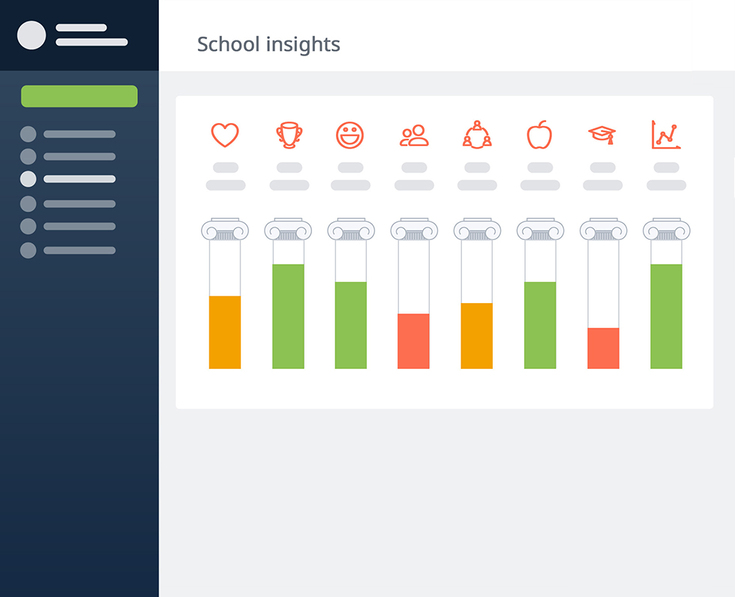
Get a holistic view of climate and culture with school or district insights across key areas for staff, students and parents. The dashboard provides users with an overview for each surveyed group. The pillars provide an opportunity to evaluate successes and areas of improvement for each group. Survey results are calculated instantly and updated automatically for immediate use.
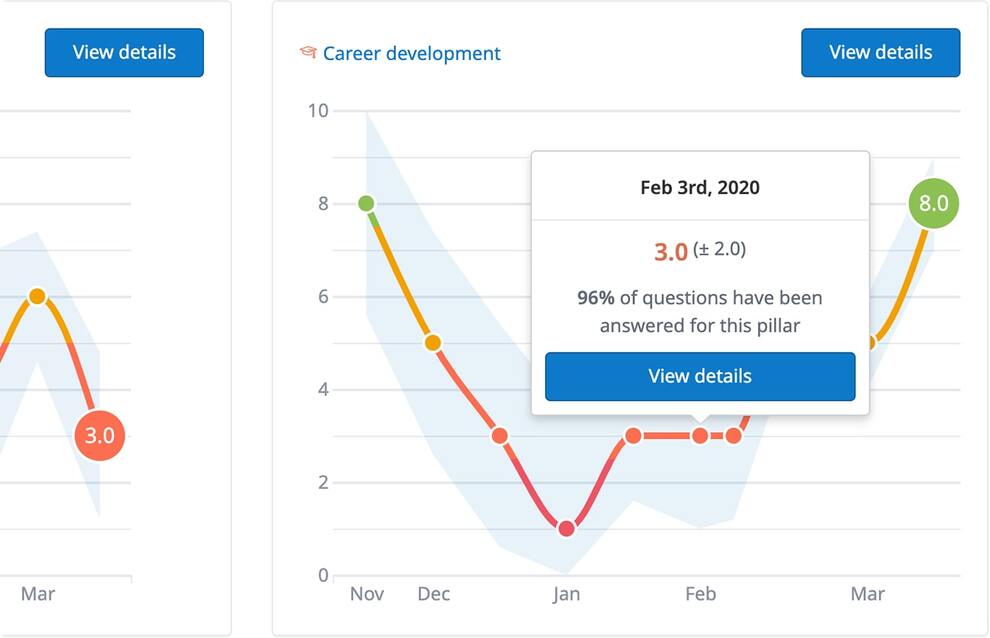
Follow the trends over time for each key area and see whether issues are a short term blip or a long term decline. Reporting options include examining trends for each climate and cultures pillar over time. Quickly evaluate stakeholder feedback and changes throughout the school year. Hover over data points to collect additional information on that particular pillar.

Dashboards help you decide where you should focus your intervention efforts and ensure your time and budgets have the best return. Districts and schools can use a variety of reporting tools to break down data by a variety of subgroups. This ensures that leaders have a pulse on who the voices represent and whether they need to take action.
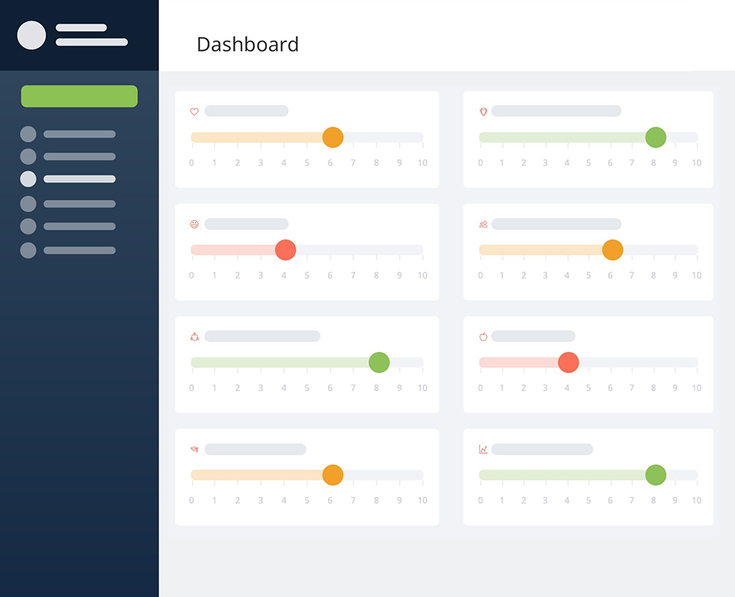
Real time, easy to read dashboards that help you instantly identify issues and track the impact of your interventions.
Consolidated survey scores are displayed visually as pillars on dynamic dashboards that show real-time data for each key area.
Trend graphs for each pillar, and each question, show you changes in opinion and give an early warning of potential issues.
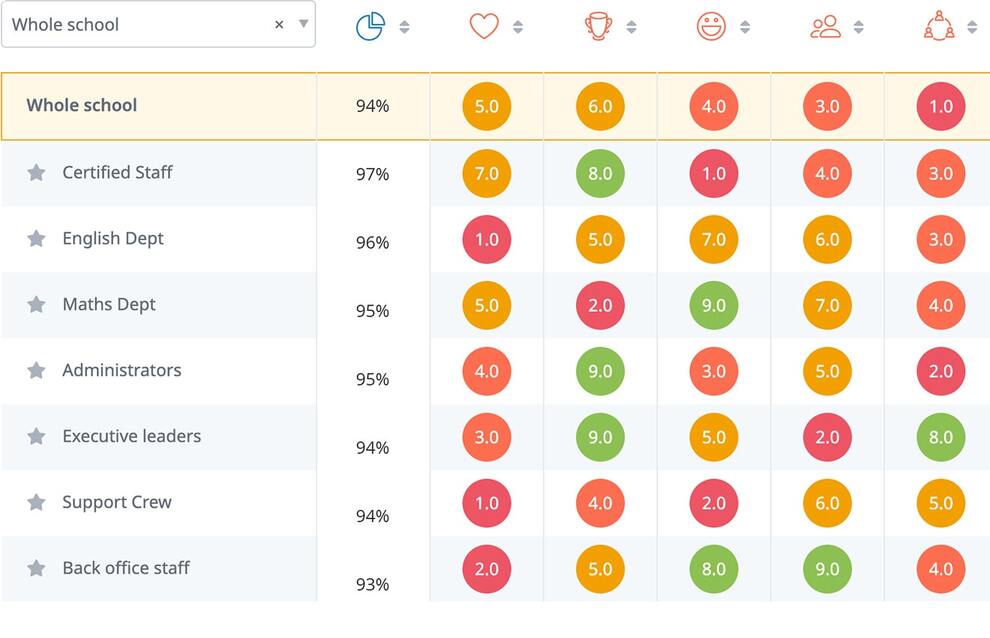
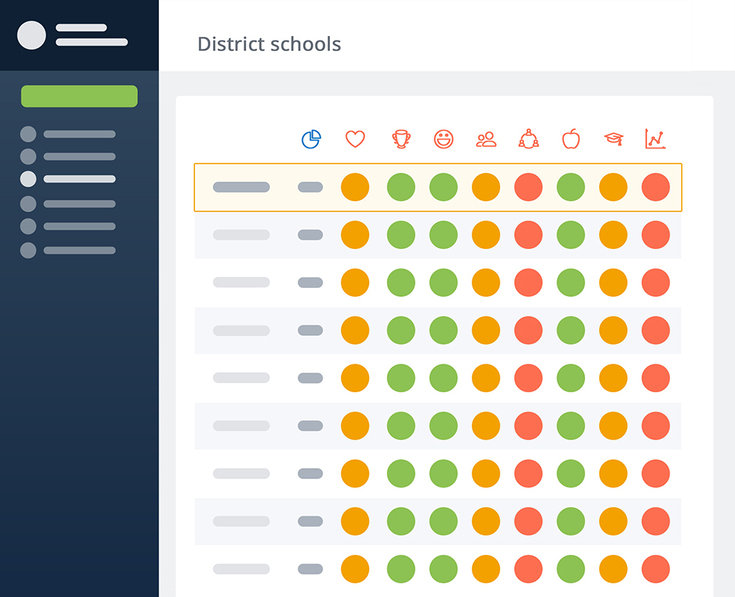
Compare scores across groups within your school or scores for schools within your district. See what’s working and what isn’t.
Visual dashboards show school and district climate data at a staff, student and parent level.
Individual users view their key area scores against the average of the whole school and see if their opinion is reflective of others.
School leaders compare scores and view trends for departments, year and staff groups and other segments within their school.
District leaders get a holistic view of all schools in their district and can compare scores and trends or drill down into an individual school.

Find out how Satchel Pulse improved the culture and climate to create a supportive learning environment for all.
View success story
Find out how Satchel Pulse increased staff participation through a platform that already has the research-supported questions.
View success story
You are in good company