

The challenge
You can't fix what you can't see
Funding is tighter. Recruitment costs are rising. Absence, behaviour and staff turnover are eating into your budget. The leaders getting ahead of it are starting with belonging.
Most Trusts are working hard on attendance, behaviour and retention, but the data that drives those conversations is always looking backwards. By the time a pattern appears, the underlying problem has been building for months.
The schools that get ahead of these challenges aren't luckier or better resourced. They're listening to the right signals, earlier.
Belonging isn't a pastoral concern. It's a performance indicator
When students feel connected and valued, they show up. When staff feel involved, they stay. These outcomes show up directly in your funding, recruitment spend and SLT capacity.
See what Satchel Pulse can save your trust with our cost calculator, before it becomes a budget problem.
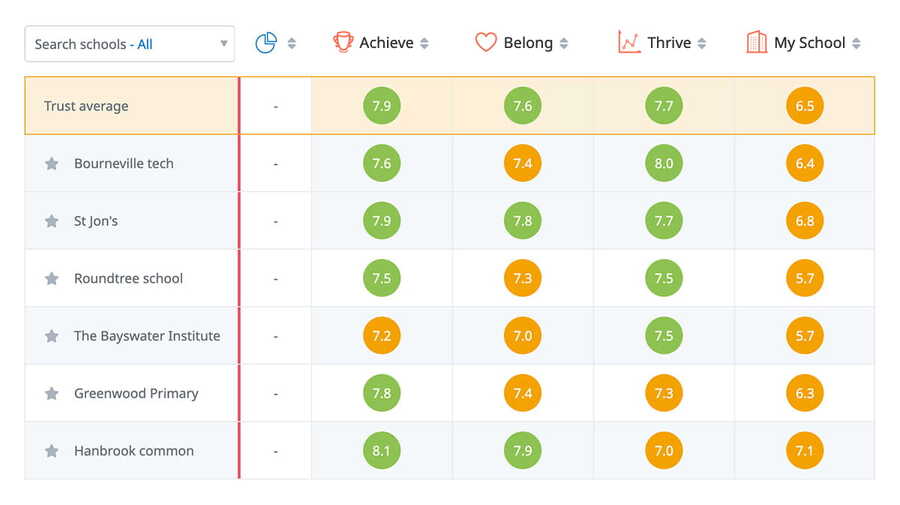
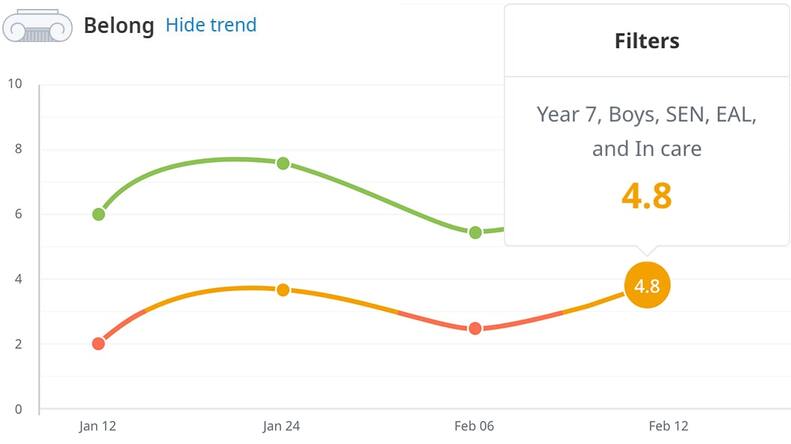
Most schools are guessing
For many schools an annual survey or a conversation in the corridor is as close as they get to understanding how students and staff really feel about being there.
It's not enough. At Trust level, inconsistent measurement means you're comparing apples with oranges across your schools. You can't identify patterns, prioritise support or track progress against a baseline that doesn't exist.
Belonging needs to be measured consistently, comparably and often enough to be useful.
Satchel Pulse will help provide the tools to gather meaningful insights into student wellbeing, engagement, and sense of belonging. By investing time and effort into this platform, we can proactively identify areas for improvement, track progress, and implement strategies that align with our Trust priorities. This approach not only strengthens our compliance with national standards but also reflects our commitment to creating an inclusive environment where every student can succeed.
Senior Trust Education Director — South Lincolnshire Academies Trust
Not another one off survey that sits in a spreadsheet
Perceptions is a real-time insights tool, that sits alongside your existing data, complementing what your MIS already tells you with the early signals it can't.
Designed to get responses
Each survey takes 5–10 minutes. Respondents use an easy sliding scale, accessible to all—including younger students. Translations are available in 40+ languages, with built-in audio read-aloud support.
Trusted questions
Use a survey from our library aligned to the Every Child Achieving and Thriving whitepaper. Questions are brief, specific, and neutral. No leading or double-barrelled questions. Add custom items for your priorities.
Tracks change over time
Perceptions is designed to run frequently, so you can see what’s shifting across your Trust and whether actions taken are making a difference. Act when costs are low, options are wider, and impact is greater.
Three audiences. One consistent picture.
Students
Connection, recognition, participation. The early signals that precede disengagement and absence.
Staff
Belonging for teachers matters too. Understanding staff culture early is far cheaper than replacing people.
Families
Parent and carer perceptions give you context that neither attendance data nor student voice can provide alone.
The insight to act, not just report
School-wide averages tell you very little. Pulse surfaces the cohorts that need attention so your schools can act with precision; earlier than any attendance or behaviour report ever could.
Spot hidden gaps
School-wide averages mask the groups that need the most support. Pulse surfaces precise cohorts, e.g. PP + Year 8 + White, that are slipping below your school's baseline before outcomes deteriorate.
Act, don't just monitor
Turn results directly into intervention groups, then go deeper with mental health screeners and skills assessments. Every low-scoring cohort becomes a clear next step — not a slide in a presentation.
Track improvement over time
Run Perceptions regularly and compare results term-on-term across your Trust. See which schools are improving, which interventions work, and where to focus support — before problems compound.